MACD SD
There are typically three metrics shown in the MACD indicator:
- Difference (in price) between the fast-period EMA and slow-period EMA (typically the 12- and 26-EMAs). This is graphed as a line called the MACD.
- A 9-period EMA of the MACD line, known as the signal line. This is the slower and smoother line.
- A histogram of the difference between the MACD line and the signal line.
Though the MACD and the other metrics oscillate between positive and negative values, the oscillator is not bound by fixed values. It can sometimes be challenging to determine when MACD seems too high or low, since the values will vary on different timeframes and on different tickers. If you have a trading system that takes signals when the MACD reaches and crosses back over extreme levels (peaks and valleys) on a 15-minute chart, those levels might be +$10 and -$10. But if you try to trade that system on the 5-minute chart, the same extremes would occur at possibly +$5 and -$5. And if you switch from SPX to a smaller ticker like SPY, those levels would be roughly +$0.50 and -$0.50.
Instead of using levels based on dollar amount, we can normalize the MACD levels to itself by measuring the standard deviation of the MACD reading over a given lookback period, and express the MACD in terms of standard deviations. This addresses all problems mentioned above. You can now look at MACD on any timeframe on a given ticker and see that it normally stays bound within +2 or -2 standard deviations most of the time. This might make it easier for you to apply the same trading system to different timeframes and symbols by deciding on the signal levels expressed in standard deviations instead of dollars. Of course all tickers will behave differently, but generally speaking, normalizing the data in this way will yield readings that are statistically easier to discern.
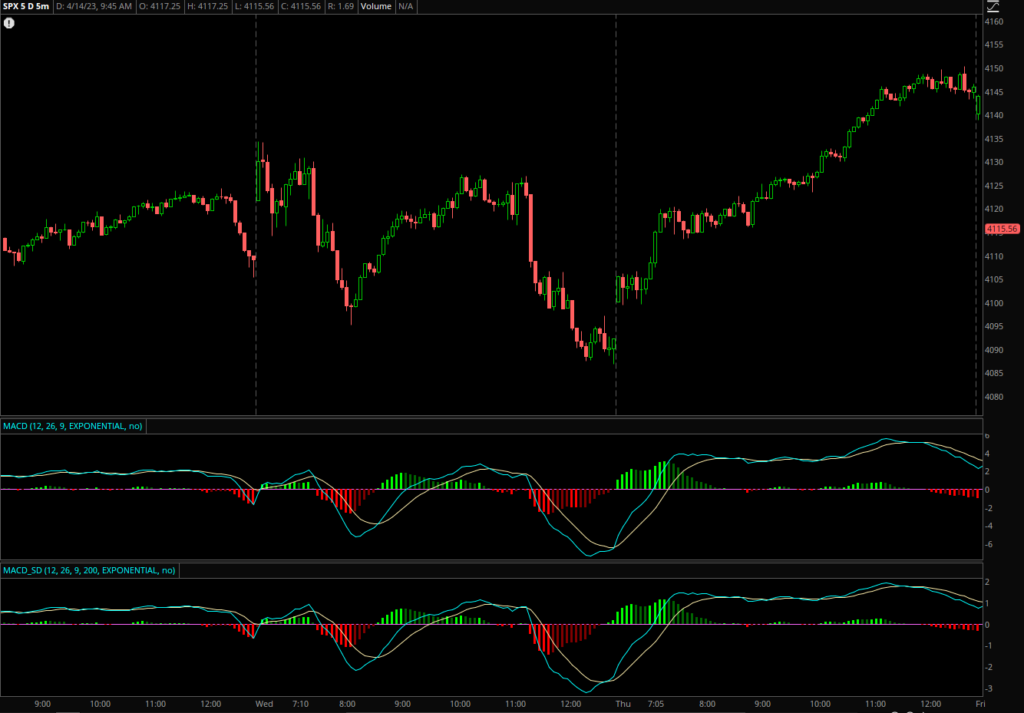
The example images below show the standard MACD and the modified MACD. Both graphs look identical, but the vertical axes show different values.

Faster settings
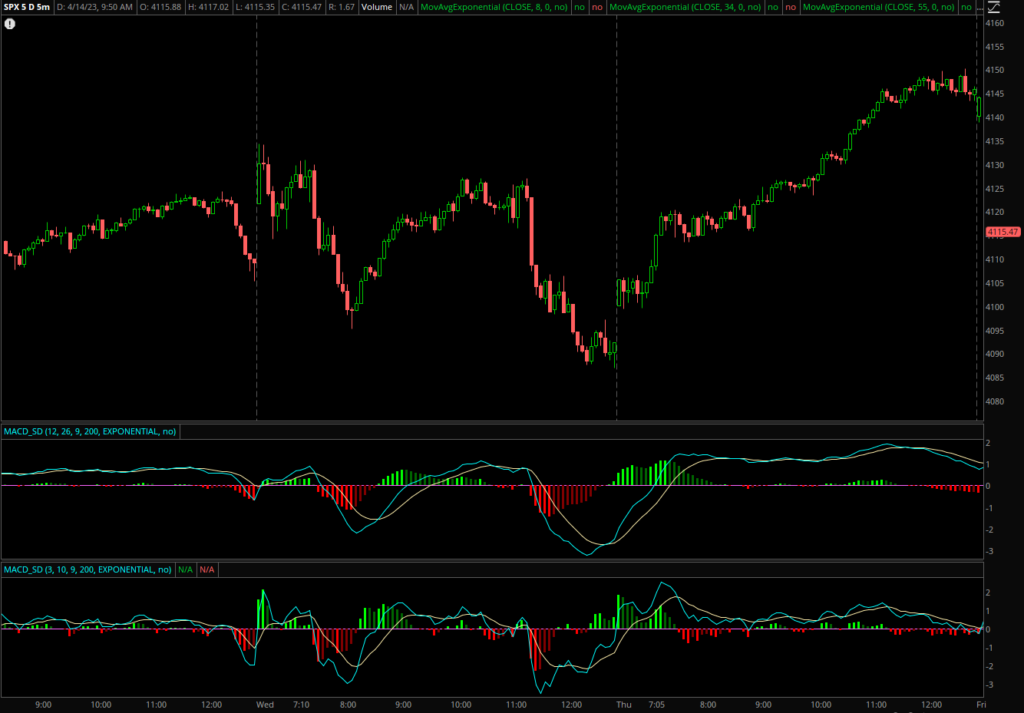
Note: the MACD SD indicator included on this page has the default EMA speeds set to 3 and 10 instead of the conventional 12 and 26. This can easily be changed if desired. Seth often uses likes the faster settings for taking early entries. Note the difference in choppiness between the two settings below. Top indicator shows MACD SD with 12/26 EMAs and the lower indicator shows the MACD SD with 3/10 EMAs.
